First detailed costs analysis, proving dynamic contracts right
After months of weekend and night work, Powa finally produces detailed charts about my electricity consumption and broken down costs. I could also prove that switching to a dynamic contract has reduced my costs by at least 30%.
Powa build in public continues. I have just reached a huge milestone: I can now visualize my electricity consumption and broken down detailed costs across:
- multiple types of meters (analog manuel index entries, smart meter with file upload from my distributor)
- multiple electricity contracts (fixed, variable and dynamic)
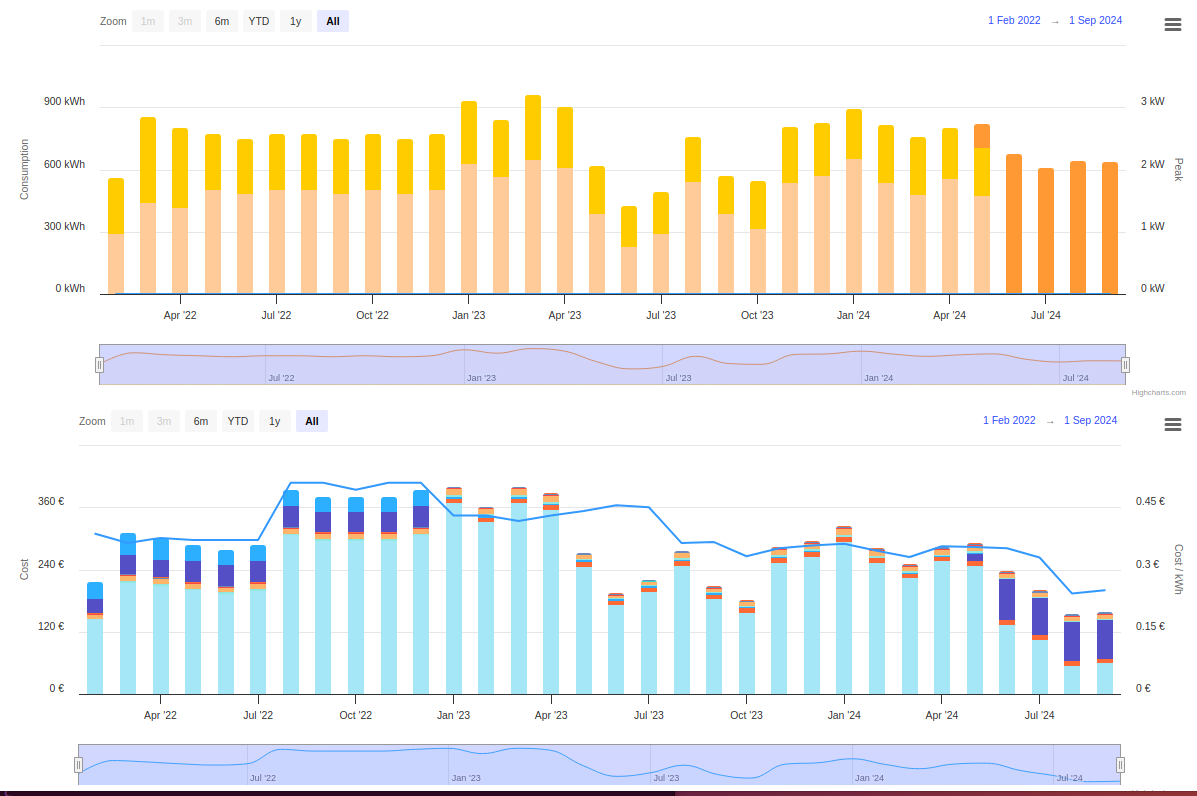
My monthly consumption and costs:
From August 24, I swiched to a dynamic contract, you can see my average cost / kWH going down from 0.40 to 0.25 €.
My hourly consumption and costs for September 2024:

You can see here that the consumption peaks corrresponds to the charges of my EV. Powa automated the charge of my EV during the moment where the cost of electricity was the lowest. You can see the cost per kWh going down below 0.20 € / kWh during EV charging peaks, which is is bringing down the average monthlky costs !
You also realize that a big part of the costs is also coming from my distributor, related to peak usage during the month. I will need to optimize that to reduce my costs even further.
This is exactly what I needed for myself and working great. I am excited for the next steps!
If you wan to try this out for yourself, pease reach out !